Multiple Linear Regression used in machine learning processes can be best explained by taking an example of a business problem.
Business problem – A funding company needs to analyze 50 companies with various factors like R&D, expense on marketing, profits, etc to check which companies suit them to invest in. This company basically needs to analyze the performance of 50 sample companies that are already in existence in different markets and see which type of companies suit them the best. They want to check the factors like R&D, market, etc to understand how much of these factors impact the profits of any company. Obviously, their main criteria of investment is the profit earned by a company. Apart from this, they are not looking to invest in the 50 sample companies given in the dataset. They want to create a model which can help them analyze various criteria for the performance of companies.
For example, they want to see in which state companies perform better – in New York or California, or they want to check that if companies are in the same state, which one of them would perform better.
Based on our machine learning model, this funding company will set up guidelines, that this type of companies are good for them to invest.
Click here to download the dataset along with the code.
Just like Simple Linear Regression is denoted by the equation y = mx + c, Multiple Linear Regression is denoted by y = m1x1 + m2x2 + …. + Mnxn + c, where
y = dependent variable
x1, x2, x3 … xn = independent variables
c = constant
A linear model is always based on some assumptions. A linear regression model will usually have some assumptions like linearity, homoscedasticity, multivariate normality, independence of errors and lack of multicollinearity. A good approach towards building a linear regression model is to first check whether these assumptions are true for the given business problem or not. If true then only proceed with a linear regression model.
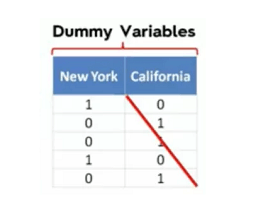
Dummy Variables
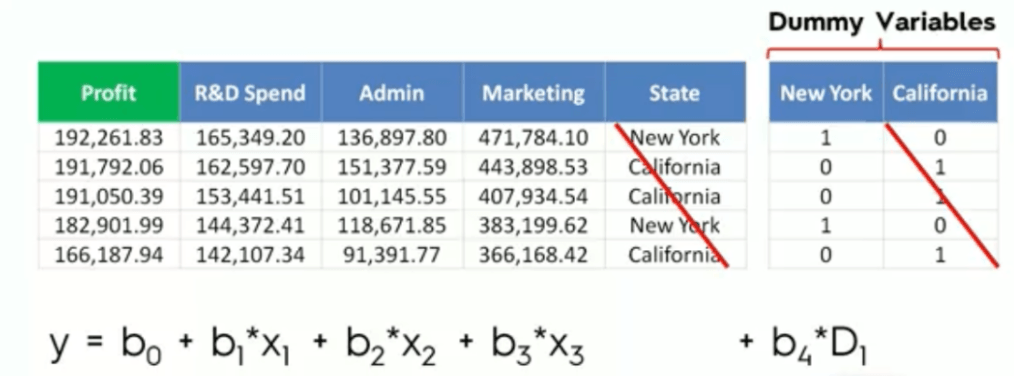
As per the above business problem and the dataset, we have the below variables.
Dependent Variable – Profit
Independent Variables – R&D, marketing, state, admin
Converting the above variables to the equation of multilinear regression, we have :
Profit(y) = R&D(m1*x1) + Admin(m2*x2) + Marketing (m3 * x3) + State(state contains text which makes it a categorical variable)
To proceed with mathematical calculations for this dataset, we need to convert the variable state into its corresponding categorical dummy variables.
Let’s say, state = New York, California. So, the new dummy variables are New York, California
Therefore, our linear equation changes to:
Profit(y) = R&D(m1*x1) + Admin(m2*x2) + Marketing (m3 * x3) + New York(m4 * D1[summy variable new york]) + c(now c will automatically take the value of california)
Dummy Variable Trap
While using dummy variables created for a categorical variable, we need to omit one of them. Say you have 2 dummy variables then use only one, or if you have 100 dummy variables, use 99. The reason is that you cannot use all the dummy variables + the constant value together. Since we will always have the constant in our equation, we will omit one of the dummy variables. Even if you have more than one categorical variable, the logic will California all of the categorical variables.
Assume you have 2 categorical variables, then
1. state –> New York, California => we will have 2 dummy variables, and we will use only one.
2. country –> India, US, Russia => we will have 3 dummy variables and we will use 2.
The final equation for above will be,
y = R&D(m1*x1) + Admin(m2*x2) + Marketing (m3 * x3) + NewYork(m4 * D1[dummy variable new york]) + India(m5 * D3(d3 = dummy variable for India)) + US(m6 * D4(d4 = dummy variable for US)) + c
So here we have omitted California from first set of dummy variables and Russia from the second set of dummy variables.
P-value
P-value is a value set by a data scientist according to his domain knowledge or measures. Let’s say this value is set to 5% or 0.05. Once the model is created and the model predicts the data, P-value is used to decide the reliability of this data. Let’s say you have assumed the data to be 90% correct and have set the p-value for this to be 0.05. This means, on performing calculations of p-value as coming from the predicted data(output), if the p-value is equal to or less than the pre-defined value, the model is fine and can be treated as reliable. However, if these values are greater than the pre-defined p-value, it doesn’t really means that the model is incorrect. It just means that your environment is not exactly the same as the environment used while creating the model,
For example – we can say that the data used to analyze this model was not sufficient. This means that the model needs more analysis, but doesn’t necessarily means that the model created meaningless results.
Building a Model
1. All IN
2. BACKWARD ELIMINATION
3. FORWARD SELECTION
4. BIDIRECTIONAL ELIMINATION
5. SCORE COMPARISION
Type 2, 3 and 4 are also referred to as Stepwise Regression.
- All In
Throw in all variables. Used only in cases where u have prior knowledge(domain knowledge), or u are forced by management to use all variable. Also used to prepare for backward elimination.
- Backward Elimination
1. Select significance level for the model. say 0.05
2. Fit full model with all possible predictors(All In approach).
— Now get rid of variables —
—-Loop Starts —–
3. Consider the predictor with the highest p-value. If P> SL(significance level) –> go to step 4, else finish.
— we have a preference for variables with p-values < SL as they would give reliable results.
4. Remove that predictor
— if u remove the variable… the model needs to be recreated as everything will be different.
5. Fit model without the above-removed predictor.
—-Loop Ends —–**Backward elimination is the fastest approach of all to create a model for multiple linear regression.
- Forward Selection
1. Select significance level for the model. say 0.05
2. Fit all possible simple regression models(y = mx+c) for each and every variable we have. select the variable which has the lowest p-value.
—-Loop starts —–
3. Keep the above-selected variable and fit all possible models with one extra predictor to the one we already selected.
— We will consider all other variables one by one with the above variable selected and calculate their p-values separately.
— For example: if we have selected x in step2 out of a,b,c,d,e,f,x,y,z… then in step three we will calculate p-values separately for the combinations of xa, xb, xc, xd, xe, xf, xy, xz and select the variable that gives the lowest p-value.
4. Consider the predictor with the lowest p-value. if P<SL –> go to step 3, otherwise finish.
— this means if the second variable satisfies – P<SL, then we will look for a third variable with the same approach with which we found variable 2. We will only stop when P<SL holds false for any variable.
—-Loop Ends —–
5. Once finished, keep the previous model instead of the current one, because it is more significant than the current model.
- Bidirectional Elimination
1. Select significance level to enter and to stay – SLENTER =0.05, SLSTAY = 0.05
—-LOOP STARTS —–
2. Perform the next step of Forward selection, i.e find all variables from the steps of forward selection(P < SLENTER).
— Let’s assume we have 5 variables at the end of forward selection
3. Now perform backward elimination on all above variables and eliminate as many as u can.(P < SLSTAY)
— Let’s assume you removed 3 variables.
4. Loop again with the remaining variables. You should exit the loop when no more variable can enter and no more variable can exit
—-Loop Ends —–
5. Model is ready.
We Salesforce administration services provide start at $2100 per month.